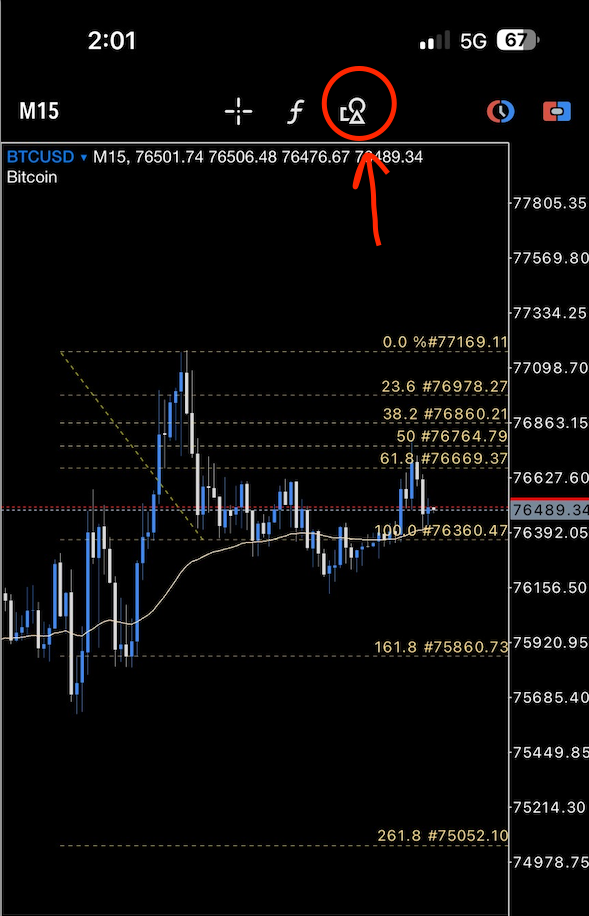
Draw a Fibonacci line, then go to the object you created at the icon above
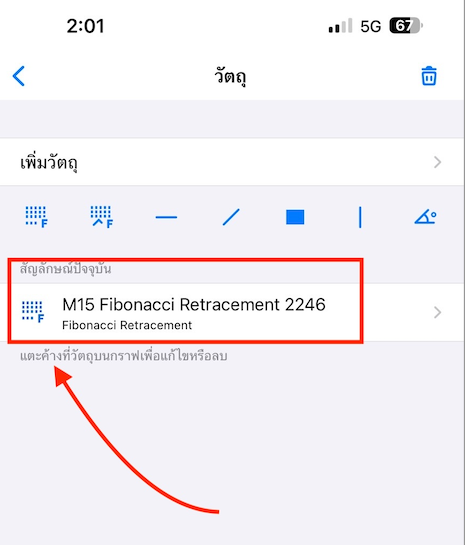
Go to the icon that was created to set various options
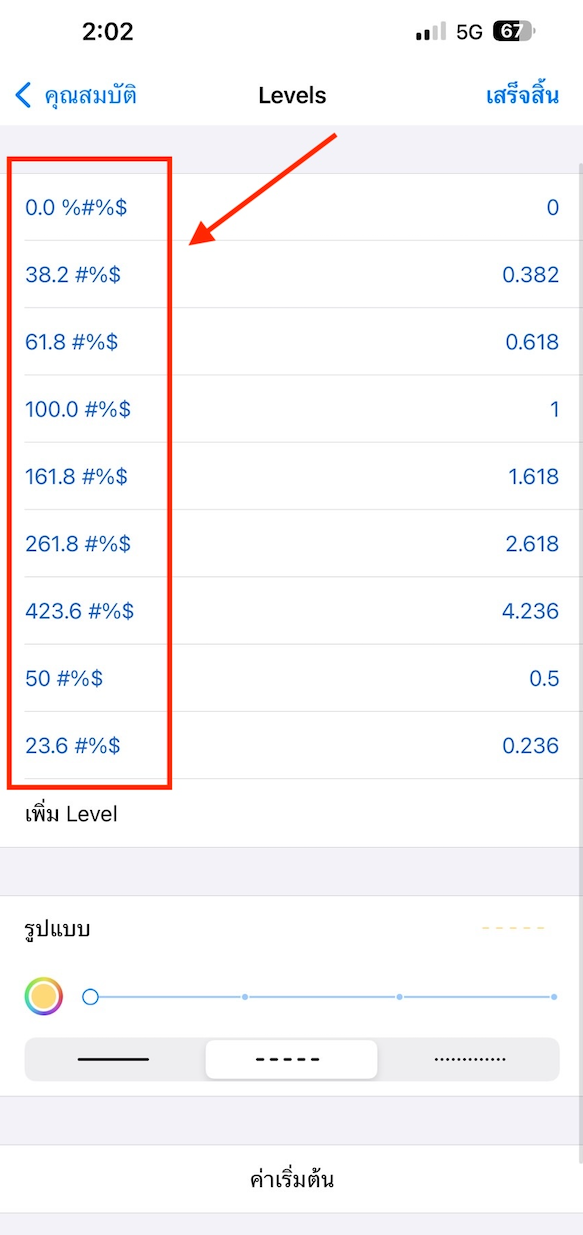
Once inside, various properties of the Fibonacci line will appear. Select options like extending the line to the right or left, adjusting line and color, etc. Then, go to the Levels section to set the description and display the price for the desired Fibonacci line position.
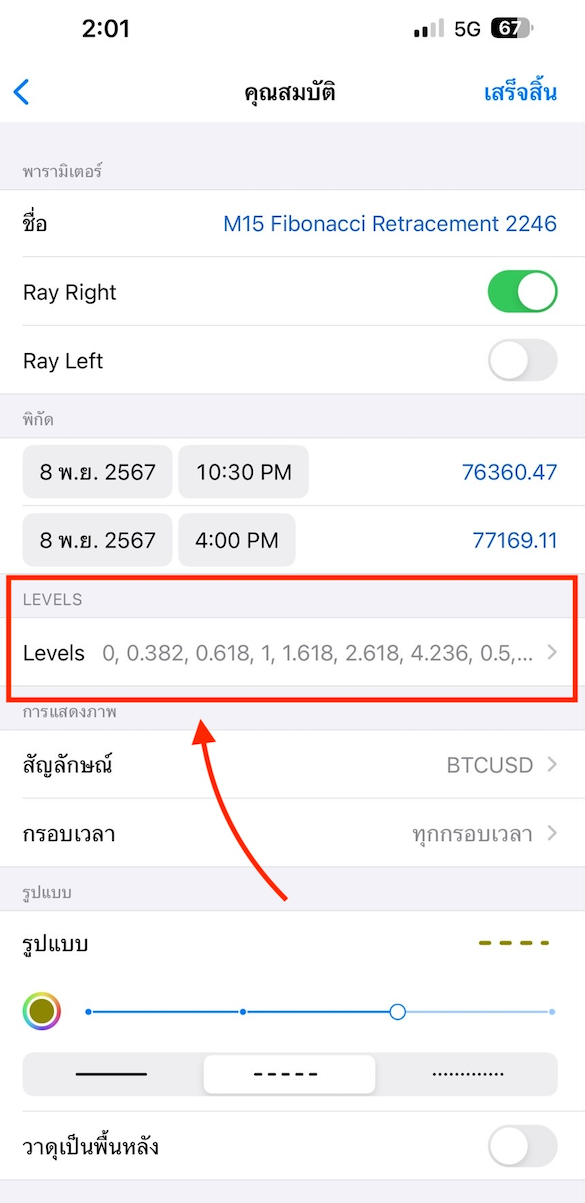
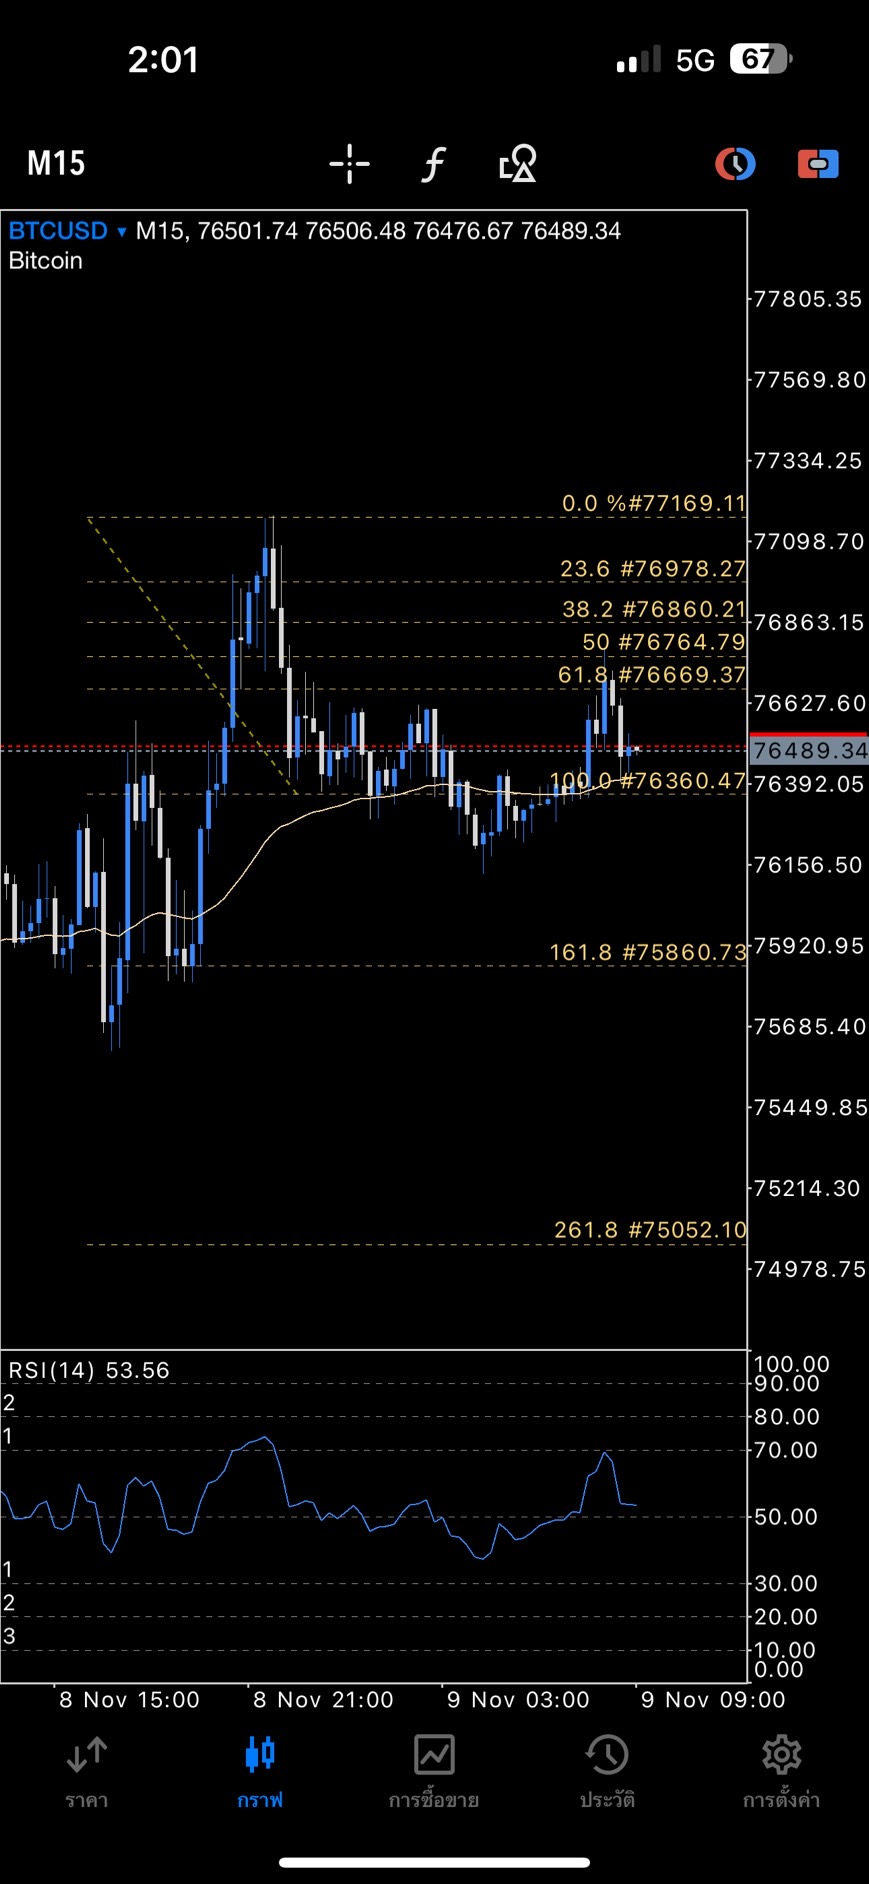
In the Levels section, set the Fibonacci numbers as desired. The left side is the description that will appear on the line. If you want the line to show prices as well, add the symbol #%$ to display the price every time you draw the line on the chart.
With just these settings, you can view prices more conveniently.


Tesla Model 3 or Model Y, which one should I choose? (22/03/2025 15:00)
...Read more
What is MQL5 and Let's Start Learning MQL5 (20/06/2024 17:30)
...Read more
Exness Forex Broker Review: Is It Reliable? Pros and Cons (27/11/2024 23:32)
...Read more
What is robots.txt and how to write it for Google SEO? (06/08/2024 21:15)
...Read more